
Our Dalgo team has been working very hard for the past few weeks and we are excited to announce a new user interface (UI) that allows people to build their data pipelines by just clicking a few buttons. This UI will help you do various transformations on your data, build production ready tables for visualization and save valuable time & effort from writing sql queries. If you are interested in trying this feature please reach out to us at support@dalgo.in , we are looking for beta users to test this out & provide their feedback. Below is the sneak peek of how the feature looks like.

Motivation
Based on our conversations with NGOs during the previous sprints & in our consulting engagements, we found that most Monitoring & Evaluation teams (MnE) in NGOs working with data do not have the necessary SQL or GitHub skills required to set up their pipelines independently on Dalgo. In addition to this, data transformation requirement(s) for an NGO keep evolving which makes them dependent on us (or the organization they are consulting with) for support. We want the NGOs to be able to use the Dalgo platform with little or no dependency and hence the idea of having a UI for transformation started gaining traction in our team. Over the course of next few weeks, (i.e. month of December & January), the product team had come up with a feature specification which was reviewed & finalized during our Goa (end of January) sprint.
Target users
The feature aims to target the members of the MnE (Monitoring & Evaluation) team of an NGO that might have very little SQL or some basic SQL skills. With that being said, the user must have a sound understanding of how data should be transformed to reach the desired output. For example, if I have a table with two columns NGO & SPOC (single point of contact). Lets say, I want to figure out how many NGOs are being handled by each SPOC, I would need to aggregate the table against the column SPOC and count the distinct names of NGO.
Another set of users that the feature does not necessarily target are people having advanced SQL skills. We found that they would prefer writing sql queries rather than using a UI to do it. Although i believe, this feature could reduce their development time significantly.
Usability
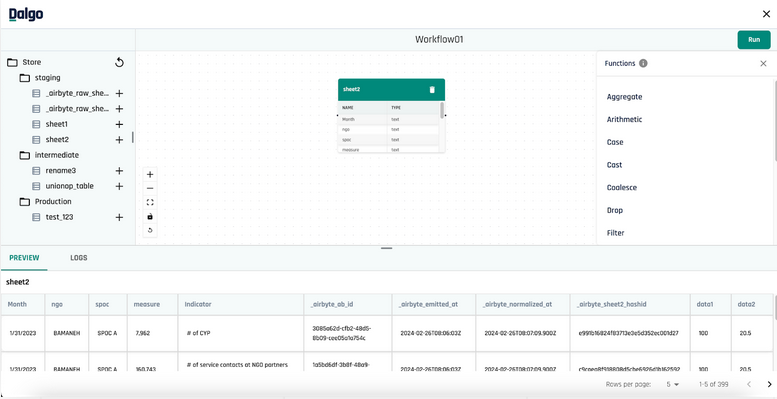
The feature offers a workflow window where a user is directed from the transform section in their Dalgo accounts.

The workflow window is divided into three sections.
- The main canvas where users can see and build their pipeline.
- The left side section shows all tables under their respective schemas fetched from the warehouse
- The panel at the bottom has a preview window to look at the data inside any table. It also has a logs tab that will show the status of a pipeline in progress.
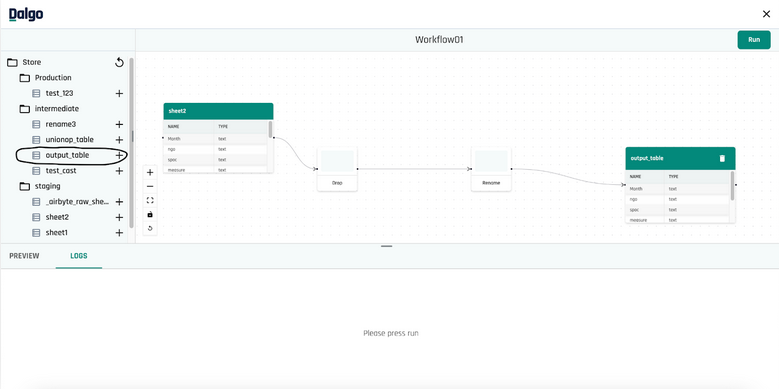
Currently, the feature supports 14 SQL transformation functions that one can use to build their pipeline. Users can also chain functions on top of another as shown below. To terminate the chain and Create a Table, all one needs to do is press that button on the right side panel. This will run the pipeline and show logs in the LOGS tab below.

As one can see below, the output table was materialized and is also present in your warehouse now. With just a few clicks, I was able to build a simple pipeline that drops some column(s) and renames a column. One can apply more advanced data transformations by using more complex SQL functions.�
Architecture
Our core transformation logic lies in an independent python package created by us which you can find here (dbt-automation, support bigquery/postgres) .This package is responsible for generating the sql logic for each function/operation and writing it to a file. The package also has the ability to return the output columns that one would see, without actually running/executing the sql for the operation.
The dbt-automation package also has the capability of chaining operations which we were able to achieve by using SQL ctes. For example, if a user has chained drop function, a rename function and a coalesce function one after the another; then the package will do this
- Wrap the drop sql logic in cte1
- Use the output of cte1 to generate rename sql logic and wrap this in cte2
- Use the output of cte2 to generate coalesce sql logic and wrap this in cte3
- Return cte3 as output of the chained transformation
Apart from generating sql logic, it also connects to a warehouse or data storage to fetch information like rows of a table, data types of a column, schemas in a warehouse etc. Any service using this package doesn’t have to worry about the type of warehouse they are connecting to. What this means is that warehouse_client.get_schemas() will do the same for Bigquery as well as Postgres, i.e. fetch schema names. The underlying motivation of doing this is code to interface rather than implement. This package will support new warehouse types as when Dalgo starts supporting it.
Dalgo’s django backend uses the above package to serve the request for chaining operations, saving/creating a table and running operations. The backend also takes care of generating/storing a directed acyclic graph (DAG) to render the pipeline in the canvas. To store the DAG all we had to do was create two new tables/migrations. One table to store the directed edge (from source to target) and another to store the nodes which are the sql models generated (& lying on the disk) when the user hits Create a Table. The backend only supports deletion of leaf nodes since deleting the node in the middle of the chain would break your pipeline.
The frontend uses a package called reactflow to render the canvas and a layouting library called DagreJS to space out the nodes in the most optimum fashion. The three major components (side panel for warehouse tables, canvas & the bottom panel for preview/logs) of the workflow screen share common state via the custom hooks created using useContext. When a user is chaining operations via the option of Add function, the frontend takes care of adding the function nodes in the canvas. The canvas is not refreshed until the user has terminated the chain by materializing it into a chain. Once the table is materialized, users can see the columns and their data types inside the node. Each table node, asks the backend for this (column name & data types) information which is served by an api that uses the dbt-automation package.
Dalgo future roadmap
We have some exciting features planned in the next 6 months that will help users to get a better understanding of their data, setup role-based access on the platform, perform quality checks on their data and take advantage of LLMs.


